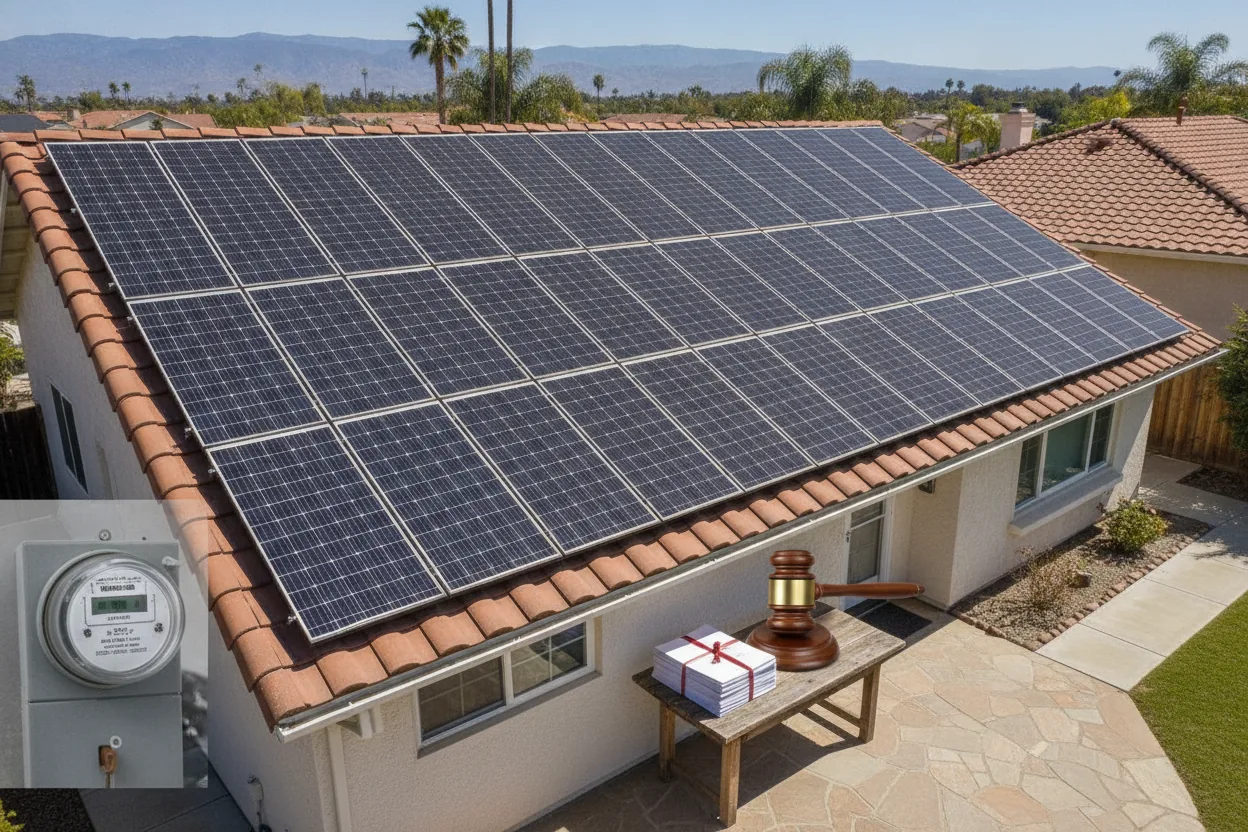
Seventy-five percent. That's how much California slashed solar export payments overnight when NEM 3.0 replaced NEM 2.0 in April 2023, and most people holding solar funds or securitized solar loans still don't realize a single utility commission vote can do that to their return. The pitch on rooftop solar is sunshine economics: stable, physical, predictable. The actual return depends on a compensation formula that fifty state regulators can rewrite at will, and one of them just did.
A Lawrence Berkeley National Lab analysis, cited in a Brookings review of the policy, modeled utility and ratepayer impacts at solar penetration levels of 10 percent, compared to roughly 0.2 percent at the time of the study. The finding: even at that much higher penetration, the effect on ratepayers stayed relatively modest. That framing matters because it directly contradicts what utilities have argued in dozens of state rate cases since then, that solar owners are shifting costs onto their non-solar neighbors at a scale large enough to justify slashing compensation rates.
Here's my thesis, and I've made it before on this blog: the financial return on a rooftop solar installation, and on every fund or securitized note built from a pool of them, depends less on sunlight and panel efficiency than on a regulatory mechanism that fifty different state commissions can rewrite at will. Solar irradiance is stable. Policy isn't. Treating net metering as a fixed input in a discounted cash flow model is the most common modeling error in residential solar finance, and it has already cost investors real money in California. The rest of this post works through exactly how that mechanism operates, who benefits when it shifts, and what it means for how you should actually read solar exposure in a portfolio.
What Net Metering Actually Does to the Numbers
NEM 3.0 Shock: What Changed Overnight in California
Source: California Solar and Storage Association, Brookings review of NEM 3.0
Net metering lets a homeowner sell excess solar generation back to the grid, typically at the retail electricity rate, and offset their utility bill dollar for dollar. That retail rate credit is the entire economic engine behind a 6 to 10 year payback period on a residential system. Strip it out and replace it with a wholesale rate, often 70 to 90 percent lower, and the payback period stretches toward 15 years or longer, well past the point where most homeowners have moved, refinanced, or simply stopped tracking the math.
California's shift from Net Energy Metering 2.0 to NEM 3.0 in April 2023 is the clearest live case study we have. Under NEM 3.0, compensation for exported solar power dropped by roughly 75 percent for new customers, and the California Solar and Storage Association reported residential solar installation volumes falling 80 percent over the following year. Sunrun and the businesses that acquired the assets of the bankrupt SunPower had to reprice new customer acquisition almost overnight.
Solar didn't fail as a technology here. A compensation formula, set by unelected commissioners after years of utility lobbying, decided whether a fifteen-year-old loan on a rooftop system still cash flows. Solar ABS notes, the securitized bundles of residential solar loans and leases sold by issuers like Sunnova and Mosaic, carry embedded assumptions about future net metering stability baked into their credit ratings. When a state commission moves the goalposts, those assumptions don't get restated. They just quietly stop being true.
If you're holding solar-backed paper, sit with this for a second: you're underwriting a regulatory bet dressed up as an energy asset, and the entity setting the terms of that bet is not on your side of the trade. So who is on the other side? The answer is more specific than "the utility."
Who Wins When the Rate Structure Changes
How a Net Metering Policy Shift Breaks Solar ABS Economics
Source: Author's analysis based on Sunnova, Mosaic, Sunrun industry commentary
Utilities have a straightforward incentive to compress net metering compensation. Every kilowatt-hour a homeowner generates and consumes on site is a kilowatt-hour the utility doesn't sell. Under most state regulatory models, utility shareholder returns are tied to capital spending on poles, wires, and generation assets, not to electricity sales volume directly. Distributed solar threatens that capital spending model at the margin, which is why utility-sponsored studies on cost shifting tend to produce larger estimated impacts than independent academic work, including the Berkeley Lab analysis referenced above.
Investors in utility equity and utility bonds are the quiet winners of every net metering rollback. A reduced solar export rate protects retail sales volume, which protects the rate base utilities earn a regulated return on, typically in the 9 to 10.5 percent authorized return on equity range across most state jurisdictions. That's a real, measurable benefit to a completely different asset class than the one marketed as the green investment. Utility dividend stability sometimes improves precisely because rooftop solar economics worsen.
Homeowners who installed before a rate change generally get grandfathered into the old compensation structure for a fixed term, often 10 to 20 years depending on the state. That creates an odd two-tier market: early adopters lock in strong returns while late entrants face a materially worse deal for an identical physical asset. A few things are happening at once here. Existing NEM 2.0 California customers keep their retail rate credits through the mid-2030s, while new California customers face wholesale-linked export compensation under NEM 3.0. Battery storage attachment rates are climbing fast as homeowners try to shift when they use their own power. And solar installers are leaning harder on storage upsell revenue than they ever did on panels alone.
That storage shift isn't incidental. It's the market's adaptation mechanism playing out in real time. Tesla Energy and Enphase have benefited directly from NEM 3.0 because pairing solar with a battery lets a household store midday generation and use it during evening peak pricing instead of exporting it at a suppressed rate. The policy change didn't kill rooftop solar economics. It redirected the profit pool toward battery hardware manufacturers, a very different investment thesis than the one most solar ETF holders think they own.
The winners here are utility bondholders and battery manufacturers, not the retail investor who bought a solar-themed fund expecting pure exposure to sunshine economics. The incentives worked exactly as built, just not for the person who assumed panels alone were the whole story. Knowing who wins only matters if it changes how you evaluate a position, so let's get to that.
How to Read Rooftop Solar Exposure Correctly
The Assumption Versus the Reality in Solar Rate Case Arguments
Source: Lawrence Berkeley National Lab analysis, cited in Brookings review; article commentary
Anyone holding a clean energy fund with meaningful residential solar installer weighting, such as Invesco Solar ETF (TAN), is carrying regulatory risk concentrated in whichever states drive the most installation volume. California, historically the largest residential solar market in the country, has already shown what a single rate structure change does to installer revenue and stock performance. SunPower's 2024 bankruptcy wasn't caused solely by net metering policy, but the NEM 3.0 transition pulled away a demand cushion the company needed while it was carrying too much debt.
The more durable read on this sector: policy risk belongs in a state-by-state model, not a national constant. Illinois and Massachusetts have built more stable compensation frameworks with regular but predictable review cycles. California, and increasingly Arizona, have shown a willingness to move fast on rate design when utility financial pressure builds. What actually separates a good solar fund from a mediocre one is which states the underlying assets sit in, not what the blended national average payback period looks like on a marketing slide.
Carbon and climate benefit claims attached to rooftop solar products remain accurate at the physical level. A panel still displaces grid electricity regardless of the compensation rate attached to it. But the investment return and the climate benefit have partially decoupled since 2023, and that gap is exactly where fee extraction and mispriced risk tend to hide in green finance. A fund can be climate positive and a mediocre or poor investment at the same time, and rooftop solar under a weakening net metering regime is turning into the textbook example of that split.
Net metering will almost certainly survive in some form in most states, so that's not really the question. What matters is whether compensation formulas keep drifting toward wholesale rates faster than battery costs fall to compensate. That race, not sunlight, is what actually prices the rooftop solar trade from here. A single commission vote already cut export payments by 75 percent once. The investors who get hurt next are the ones still modeling net metering as a constant instead of the variable it has always been.