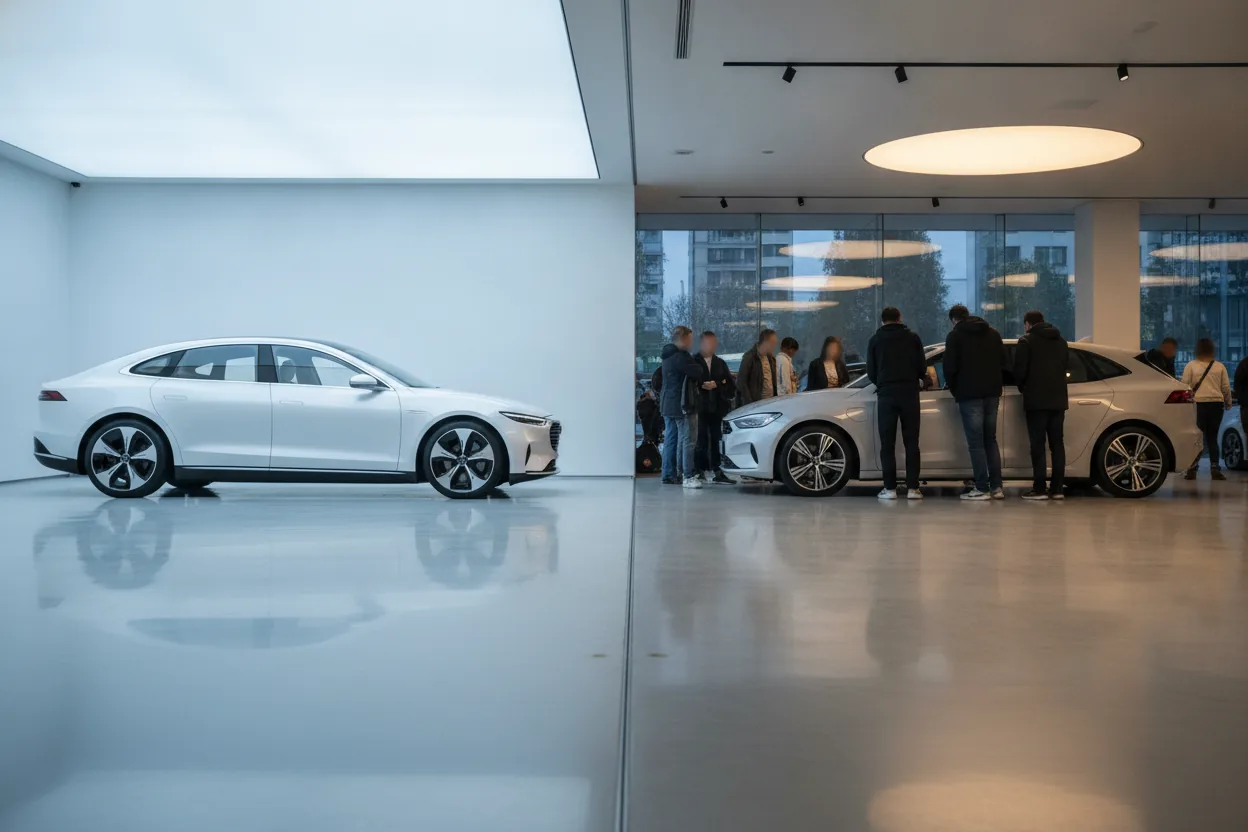
Chevrolet's EV deliveries reportedly took a real hit in a single reported month of 2026, while Toyota's jumped 225 percent in that same window. Thematic EV ETFs like KARS and DRIV are built on the idea that bundling automakers together smooths out exactly this kind of divergence, charging fees somewhere in the usual range for thematic ETFs along the way. But a fund can't smooth out a sector where one holding is shrinking and another is tripling at the same time. It can only average the two and call the result diversification. If the basket doesn't protect against dispersion this wide, and picking individual winners carries its own hidden costs, what's actually driving the gap between Tesla and everyone else?
The headline story is simple: Tesla still leads. The more useful story, the one that actually moves portfolio decisions, is the dispersion underneath that headline. One manufacturer's monthly deliveries swing 225 percent up while another swings 50 percent down, in the same market, same month. That's not a maturing industry. That's a sector where winners and losers get decided in real time, and most thematic EV funds are built in a way that makes them blind to exactly that distinction.
Investors Assume EV Exposure Means Diversified Exposure
2026 Reported Month: EV Delivery Dispersion by Automaker
Same Market, Same Month, Opposite Directions
| Automaker | Metric | Direction |
|---|---|---|
| Toyota | +225% | Surge |
| Rivian | +6% | Flat |
| Ford | Drop | Decline |
| Chevrolet | -50% | Sharp decline |
One reported month. One sector. A 275 percentage point swing between the best and worst performer.
Source: Source: Article citing widely cited 2026 EV delivery figures
The retail pitch for EV investing usually runs through a thematic ETF: something like KARS, DRIV, or IDRV, funds that bundle automakers, battery suppliers, and charging infrastructure names into a single ticker. The pitch assumes that spreading money across twenty or thirty EV-adjacent companies smooths out the risk of betting on any single winner. Ford stumbles, Hyundai picks up the slack. BMW's electric line underperforms, Toyota's hybrid-heavy strategy covers the gap. That's the theory, anyway.
The 2026 sales data breaks the assumption cleanly. Widely cited figures put Chevrolet's deliveries down sharply in the reported month, with Ford posting a meaningful drop of its own. These aren't small dips inside a generally rising tide. They're structural retreats from companies that spent the better part of three years telling shareholders EVs were the future of the business. Rivian, meanwhile, a name most thematic funds hold as their growth EV bet, delivered 12,194 vehicles in the quarter, up about 6 percent year-over-year. That's flat performance dressed up as momentum.
Here's the mechanical problem. A market-cap-weighted EV ETF gives exposure proportional to size, not proportional to execution. Tesla's dominance means it already carries outsized weight in most of these baskets, which sounds like it should protect returns. But funds like KARS also hold meaningful positions in suppliers and legacy automakers whose EV divisions are shrinking as a share of revenue. So the fund charges an expense ratio, with some analysts pointing to figures in the range of roughly 60 to 70 basis points depending on the fund, to hold companies moving in opposite directions at the same time. That's not a bet on electrification. It's a bet that the winners' gains outrun the losers' losses, priced through a fee structure that doesn't care which way the bet goes.
If diversification inside a single ETF wrapper doesn't protect against this kind of dispersion, the next question is what the alternative costs. Buying individual automakers instead of the basket looks like the obvious fix. It brings its own problems.
Selective Stock Picking Costs More Than the Fund Sheet Admits
What a Thematic EV ETF Actually Holds
One Ticker, Opposite Bets Bundled Together
Blue: Dominant winner, already outsized weight
Amber: Rivian-type names, flat despite growth headlines
Purple: Battery and charging suppliers
Red: Legacy automakers with declining EV share, e.g. Chevrolet, Ford
Illustrative composition. The fund averages a shrinking segment against a tripling one and calls it diversification.
Source: Source: Article description of KARS, DRIV, IDRV holding composition
The obvious response to dispersion risk is to go narrower: buy Tesla directly, buy Toyota directly, skip the basket entirely. Toyota's 225 percent jump in the reported period looks like validation of that instinct, a single stock outrunning an entire thematic category. This is where retail investors chasing the headline number tend to get the mechanics wrong.
Toyota's EV growth is coming off a genuinely small base. The company spent years prioritizing hybrid technology over full battery-electric models in the American market. A 225 percent increase on a low starting volume is a different animal from Tesla's dominance, which rests on hundreds of thousands of annual units. Percentage moves without denominators are one of the most reliable ways retail narratives get built on numbers that sound identical but mean nothing alike.
Widely cited figures put Kia's percentage increase at a substantial level, with Subaru posting a jump of roughly similar magnitude, while Cadillac reportedly sold in the neighborhood of several thousand units with modest growth. These are real numbers, and they say something real about manufacturer strategy shifts. But they describe companies still building their EV identity from a small production base, not companies competing with Tesla's charging network advantage or its manufacturing scale in Texas and Nevada. An investor buying into the Toyota EV story or the Subaru EV story based on headline percentage growth is often buying a rounding error dressed up as a trend.
Cadillac's numbers deserve a specific mention because they expose the limits of using growth rate alone as a signal. Cadillac sold around 4,000 units, up 5 percent, which sounds unremarkable next to Toyota's headline figure. But 4,000 units at a luxury price point, against a base that was already meaningful rather than negligible, likely represents steadier unit economics than a 225 percent jump off a few hundred vehicles. Growth rate shows direction. It says nothing about the denominator, and nothing about margin. Chevrolet and Ford both posted negative growth on volumes larger than several of the companies posting flashy increases, exactly the kind of detail that gets lost when headlines compress a complicated market into a single ranked list.
None of this means picking individual automakers beats buying the basket. The basket and the single stock fail for different reasons, and neither failure mode shows up clearly in a fund sheet or a headline chart. Both share one blind spot, though: they price the manufacturer's badge, not the infrastructure the manufacturer depends on. That infrastructure is where the real distinction sits.
Charging Infrastructure Reveals Where the Real Moat Sits
The Hidden Cost of Averaging Winners and Losers
Diversification Has a Price Tag Regardless of Outcome
|
Expense ratio range 60 to 70 bps |
Toyota delivery jump +225% |
Chevrolet delivery hit Sharp drop |
The fee is charged regardless of which holding wins. Investors pay 60 to 70 basis points to hold a shrinking automaker and a tripling one in the same wrapper, betting only that gains outrun losses.
Source: Source: Article commentary on thematic EV ETF expense ratios
The claim about Tesla's charging network advantage does more analytical work than it first appears. This isn't a marketing claim. It describes a structural asset that shows up nowhere on a standard EV automaker's income statement, and retail investors routinely misprice it. Tesla's Supercharger network, now opened in part to other manufacturers under the North American Charging Standard, functions less like a customer amenity and more like toll infrastructure, similar in economic logic to a pipeline or a rail network, except the asset is charging stalls instead of steel. Ford, General Motors, and Rivian have all signed agreements to access that network rather than build a fully competing one from scratch. That tells you something about the relative cost of building versus renting infrastructure in this specific market.
Charging infrastructure investment vehicles, including names like CHPT or broader industrial and utility plays tied to grid buildout, offer a different entry point into the EV theme entirely, one based on the picks-and-shovels layer rather than the badge on the hood. Some investors chose to buy railroad and pipeline companies during earlier industrial buildouts rather than bet on which manufacturer would dominate freight volume. Same logic here. The manufacturer competition in this month's sales data, Chevrolet down, Toyota up, BMW down, Kia up, is precisely the kind of volatility that infrastructure exposure is designed to sit above.
The risk in that infrastructure thesis is concentration and regulatory dependency. Charging network economics rely heavily on utilization rates, and utilization rates rely on the total EV fleet actually growing across the country, not just reshuffling market share between Chevrolet and Toyota. If overall EV adoption growth in the United States slows because of changes to federal tax credit structures, a risk that has already partially materialized following adjustments to the EV purchase incentive framework earlier in this decade, infrastructure investments face a demand ceiling no matter which automaker wins the badge war. The exact figure on how much US EV adoption growth has decelerated due to credit changes varies by source and methodology, so treat this as an observed policy risk rather than a fixed number: the tendency is real, the precise percentage is contested.
Strip away the manufacturer rankings and this sales data proves something simple: the clean transport transition isn't one trade. It's at minimum three separate trades stacked on top of each other. The vehicle manufacturer trade is volatile and momentum-driven, swinging on monthly delivery numbers. The infrastructure trade runs steadier but gets capped by adoption speed and policy support. And the battery materials trade sits further upstream still, depending on entirely different variables like lithium pricing and mineral supply contracts that have nothing to do with whether Cadillac sold 4,000 or 40,000 units this month. Investors treating EV exposure as a single decision are collapsing three distinct risk profiles into one number. Tesla's lead in the headline figures is real, but it's not what determines whether an EV investment holds up. What determines that is which of these three trades an investor is actually making, and whether the fund, stock, or infrastructure play they bought matches the trade they think they're in.