86%. That's the year over year revenue growth Lithium Royalty Corp reported for the third quarter of 2025, and it's the number its sponsorship copy leans on without ever explaining where it came from. Lithium carbonate prices in China have been flat for most of the year, so the growth didn't come from the metal getting more valuable. It came from two Argentine mines, Mariana and Cauchari Olaroz, ramping toward full production. The real question is whether that mechanical fact changes what the 86% headline should mean to anyone holding the stock.
Royalty revenue growth and commodity price growth are two different things, and the gap between them is where the real story about lithium investing in 2026 lives. Chinese lithium carbonate prices have been grinding sideways for most of the year, hovering in a band that would have looked catastrophic to anyone who bought in during the 2022 spike. Yet a royalty company built around that same commodity is posting growth numbers that sound like a boom. That's not a mistake in the data, it's the mechanism working as designed, and understanding that mechanism is the actual edge here, not the headline percentage. Below: how a royalty agreement separates cash flow from price, what specifically produced the 86% figure, how the Chinese pricing benchmark feeds into all of it, how the royalty cost structure compares to other climate-themed products, and what the broader supply picture suggests about whether this growth rate can repeat.
A Royalty Agreement In Australia Shows How Cash Flow Splits From Price
LIRC's 86% Revenue Jump: Price Flat, Volume Up
Two Different Growth Drivers, One Headline Number
Chinese Lithium Carbonate Price
Flat
Sideways for most of 2025
LIRC Revenue Growth YoY
+86%
Q3 2025 vs Q3 2024
Gap explained by production ramp, not price, at two Argentine mines
Mariana
Operator: Ganfeng Lithium
Ramping to fuller output through 2025 to 2026
Cauchari Olaroz
Operator: Zijin Mining
Similar ramp curve, Salta province
Source: Lithium Royalty Corp Q3 2025 results; article analysis
Core Lithium's Finniss project in Australia paused mining operations in January 2024 when weak pricing made continued output uneconomical. Lithium Royalty Corp still held its claim on future production once the mine restarted. That single episode explains the structural appeal of the royalty model better than any summary statistic could.
LIRC, listed on the Toronto Stock Exchange under the ticker LIRC, doesn't mine lithium. It holds royalty and streaming agreements on more than 30 projects, collecting a percentage of revenue or production value from mines operated by other companies. Its portfolio spans Finniss, Sigma Lithium's operation in Brazil, and the Cauchari Olaroz and Mariana projects in Argentina, which the author understands to be operated by Zijin Mining and Ganfeng Lithium respectively, though readers should confirm current ownership before relying on it.
A royalty holder isn't exposed to the capital cost overruns, labor disputes, or operational failures that sink mining equity returns. Royalty investors buy a claim on revenue, not a claim on operational competence. That distinction matters enormously in a sector this volatile, because mining companies routinely destroy equity value through dilution, debt restructuring, and project delays that have nothing to do with the underlying commodity's long term demand story. The Finniss pause is a direct example: Core Lithium's equity holders absorbed the operational hit, while LIRC's claim on future production simply waited.
What this means practically is that a royalty company's quarterly revenue can jump sharply even when commodity prices are flat, simply because new mines in its portfolio hit production milestones or because existing mines expanded output. That's a legitimate operational story. It's also one that can be marketed in ways that blur the line between organic growth and the kind of growth any investor should expect from simply holding the metal. The next section applies this exact distinction to the 86% number itself.
Two Argentine Mines Explain The 86% Number
How a Royalty Claim Survives an Operational Shock: The Finniss Example
Royalty Revenue Decouples From Mine Operating Risk
Step 1: Finniss Mine Operating Normally
Core Lithium produces, LIRC collects royalty on revenue
Step 2: January 2024, Weak Pricing Forces Pause
Core Lithium halts mining; equity holders absorb the hit
Step 3: LIRC's Royalty Claim Remains Intact
No production income, but no capital loss or dilution exposure either
Step 4: Mine Restarts, Royalty Resumes
LIRC's claim on future production simply waited out the pause
Source: Core Lithium Finniss project timeline, as described in article
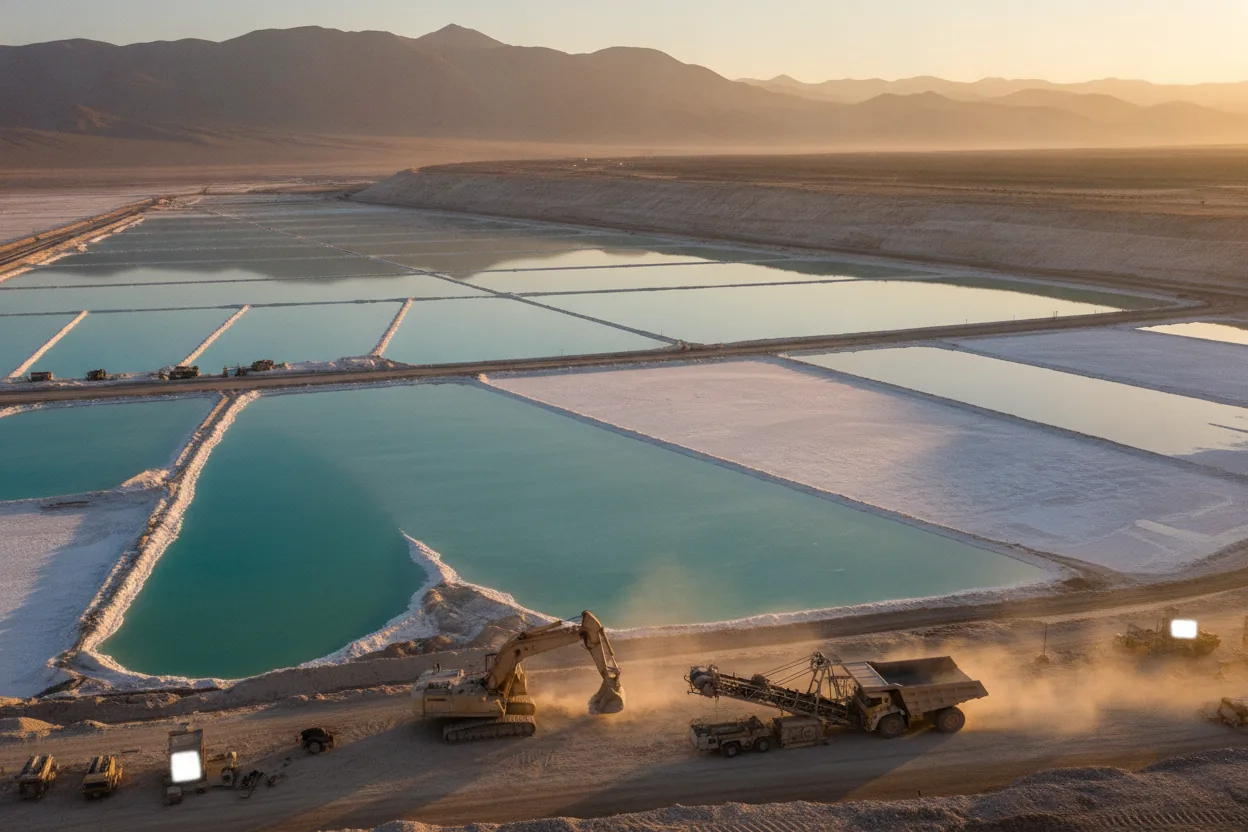
Ganfeng's Mariana lithium brine project in Argentina has been moving toward fuller commercial output over the past couple of years, with ramp-up continuing through 2025 and into 2026. Zijin's Cauchari Olaroz project, also in Argentina's Salta province, has followed a similar curve. Both sit in LIRC's portfolio.
When two major royalty paying assets go from partial output to fuller production within the same comparison window, the year over year revenue figure at the royalty holder level jumps even while the price per tonne of lithium carbonate equivalent stays depressed. That's the mechanical explanation for the 86% figure, and it's a real and defensible one. It's also a reminder that royalty revenue growth rates get driven by a small number of discrete project milestones rather than by broad commodity market strength.
A retail investor reading that single growth number without understanding the production ramp behind it could reasonably conclude lithium demand snapped back hard in 2026. The more accurate read is narrower: specific mines that were ramping toward design capacity got there, or got closer, during the measurement period.
The risk sitting underneath this kind of growth is concentration. A royalty portfolio with 30 plus agreements sounds diversified until you look at how much of the revenue comes from just two or three assets. If Mariana or Cauchari Olaroz slow down, whether from brine extraction issues, water permitting disputes in Argentina, or Chinese demand softening further, next year's growth comparison could invert just as sharply in the other direction. Royalty investors are betting on the operators of someone else's mines executing on schedule, and that schedule is lumpy by nature. The Chinese demand side of that risk is worth examining directly, since it sets the price these mines sell into.
Chinese Spot Prices Function As The Global Benchmark
Royalty Model vs. Mining Equity: Who Absorbs What Risk
Structural Exposure Comparison
| Risk Factor | Mining Equity | Royalty Holder (LIRC) |
|---|---|---|
| Capital Cost Overruns | Fully Exposed | Not Exposed |
| Labor Disputes | Fully Exposed | Not Exposed |
| Equity Dilution Risk | Fully Exposed | Not Exposed |
| Commodity Price Swings | Fully Exposed | Indirectly Exposed |
| Production Ramp Upside | Shared With Dilution Cost | Direct Revenue Upside |
Source: Article analysis of LIRC portfolio structure and Core Lithium case
Walk into any conversation about lithium pricing in 2026 and within two sentences someone brings up Chinese battery grade carbonate prices on the Guangzhou Futures Exchange. China refines the overwhelming majority of the world's lithium chemicals and dominates battery cell production, so Chinese spot prices set the global price regardless of where the raw ore or brine originated.
Chinese lithium carbonate prices spent much of 2024 and 2025 in a prolonged slump as a wave of new supply, particularly from Chinese lepidolite producers in Jiangxi province, overwhelmed demand growth from electric vehicle sales. Beijing's periodic moves to curb what it calls disorderly competition in the lithium sector, including production discipline campaigns aimed at marginal lepidolite operations, have produced short rallies that fade once the targeted producers find ways to keep output flowing anyway. This is the single most important variable for anyone holding lithium equities, royalty companies, or battery metal ETFs, and it's also the variable retail investors have the least direct visibility into.
For a royalty company like LIRC, this cuts two ways at once. Lower prices compress the revenue royalty holders collect on a percentage of sale basis, but new mine ramps can offset that compression, which is exactly the dynamic playing out this quarter. For a broad commodity exposure product like USCF's Sustainable Battery Metal Strategy Fund, which the author understands trades under the ticker ZSB and is intended to spread exposure across lithium, cobalt, copper, nickel, aluminum, and silver, though readers should verify the fund's current ticker and holdings directly, Chinese pricing power over lithium specifically gets diluted by the basket structure.
That diversification cuts both ways. It protects against a single commodity collapse but also means an investor betting specifically on a lithium recovery gets a watered down version of that thesis inside a multi metal wrapper. Comparing that wrapper's cost structure to LIRC's royalty model clarifies who actually captures the upside when prices do recover.
The Royalty Model Carries A Cleaner Cost Structure Than Most Climate ETFs
A royalty company charges investors through its share price and the spread between what it collects from mine operators and what it returns to shareholders via dividends or reinvestment. A commodity ETF charges through its expense ratio, roll costs on futures contracts where applicable, and tracking error against its stated index or strategy. Every financial product built around the energy transition carries one version of this cost structure or another, and that structure decides who actually benefits when the underlying thesis plays out.
These structures aren't inherently predatory, but they aren't neutral either. A royalty model like LIRC's aligns incentives reasonably well with long term commodity exposure because the company's revenue genuinely depends on mines producing and selling lithium at whatever price the market sets. There's no fee extraction layer sitting between the commodity and the shareholder beyond the normal cost of running a public royalty company. That's a cleaner structure than many green themed ETFs charging 40 to 75 basis points annually to hold a basket of equities with only a loose connection to the climate transition thesis marketed on the fund's landing page.
Where things get murkier is how growth numbers get presented in investor facing content. An 86% revenue growth figure, cited without the production ramp context behind it, functions as marketing even when every number in it is accurate. This pattern is standard across clean energy finance: take a real number, strip the context that explains why it happened, and let the reader's assumption about commodity markets fill in the gap. The number is true. The implied story, that lithium demand broadly surged 86%, is not.
Royalty revenue growth at a company like LIRC actually traces back to a small set of factors. New mine production ramps reaching design capacity matters most, followed by existing mines expanding processing throughput. Beyond that: royalty rate structures tied to gross revenue rather than net, foreign exchange movements between the Canadian dollar and mine operating currencies, and portfolio additions from newly acquired royalty agreements.
Only one of those factors has anything to do with lithium's underlying demand story, and even that one, portfolio additions, is a function of corporate development decisions rather than market demand. A revenue growth headline sitting on top of this list says almost nothing about whether electric vehicle adoption or grid storage buildout accelerated. It describes capital allocation choices and project timing, a narrower claim than the one the headline implies. The remaining question is what the broader supply side of the market is doing while royalty holders collect on these ramps, since that determines how long the current setup lasts.
Albemarle's Capex Cuts Show Why Royalty Holders Do Not Need To Time The Bottom
Albemarle, the largest listed lithium producer by market capitalization, has spent 2025 and 2026 cutting capital expenditure and idling higher cost capacity in response to the prolonged price slump, a pattern mirrored by SQM in Chile and several Australian hard rock producers. This is the supply side adjustment that eventually resolves oversupply cycles in every mined commodity, and it's happening slowly rather than dramatically, which is exactly why lithium hasn't produced the kind of sharp, catalyst driven rally that grabs retail attention.
Royalty structures are built for this kind of grinding, multi year adjustment. LIRC doesn't need to time a price bottom correctly because it isn't making capital allocation decisions about when to expand or idle production. It collects its contracted percentage regardless of whether the operator is profitable at current spot prices, within the limits of royalty floor and ceiling provisions that vary by agreement. That's a structurally different risk profile than owning equity in a mining company that could face covenant breaches or equity dilution if prices stay depressed long enough.
Argentina's lithium triangle still carries water rights disputes and provincial regulatory risk that no royalty agreement fully insulates against. Chinese production discipline campaigns have repeatedly failed to hold prices up for long, which suggests the market structure, not policy intent, is the real constraint. What the 86% figure actually shows, once the marketing framing gets stripped away, is that production ramps at two Argentine brine projects are translating into real cash flow for a specific royalty portfolio, not that lithium demand broadly surged.
That's the resolution to the number this piece opened with: 86% is a real, mechanically explainable figure produced by two mines reaching fuller output, not a signal that the lithium market turned a corner. It's a useful data point about a specific royalty portfolio. It is not a verdict on whether lithium itself is back.