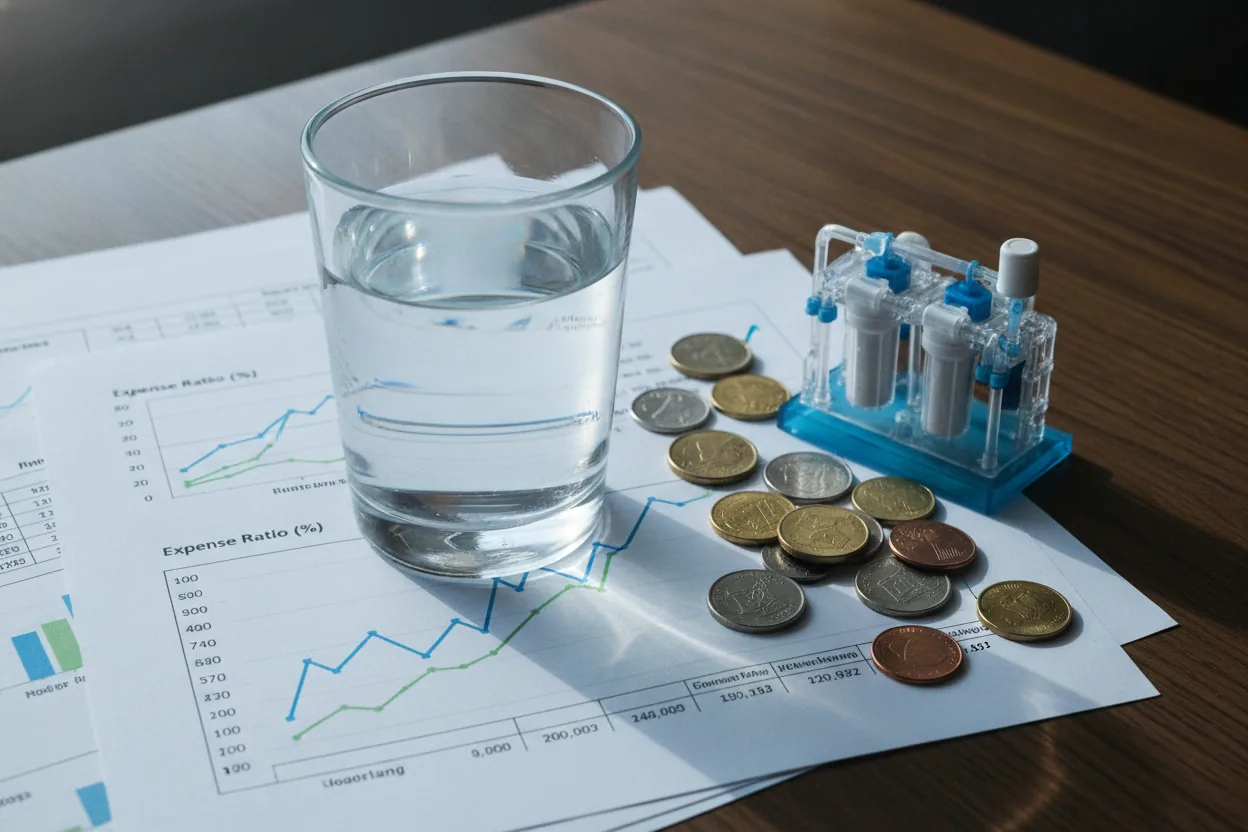
An investor who bought into the water scarcity thesis in early 2022 watched their position fall not because the thesis broke down, but because duration risk buried inside utility-heavy index construction drove the drawdown while the water crisis kept getting worse. That raises a pointed question: are water ETFs designed to capture the infrastructure opportunity, or simply to price it? The largest water ETFs in 2026 charge expense ratios clustering around 0.50 to 0.60 percent, five times the cost of a plain-vanilla index fund, for funds whose top five holdings can account for more than a third of the portfolio and behave like rate-sensitive utility bonds during Federal Reserve tightening cycles. The marketing sells scarcity and infrastructure buildout. The actual portfolio delivers regulated cash flows capped by the same regulators who protect the revenue floor.
Water ETFs as a category have attracted sustained inflows because the underlying thesis is genuinely sound. Climate-driven drought cycles are tightening freshwater supply in regions that feed global agricultural output. Municipal systems in the United States, the UK, and across emerging markets are running decades behind on replacement capital expenditure. The IMF and World Bank have both flagged water stress as a systemic economic risk, not merely an environmental one. The macro case holds. What deserves closer examination is whether the specific fund structures capturing that thesis are priced and designed to deliver on it, or to reward the asset manager.
What Water ETFs Actually Hold
Water ETF Fee and Concentration Comparison (2026)
Water ETF Fee and Concentration Comparison (2026)
| Fund | Ticker | Expense Ratio | Top 5 Holdings Weight |
|---|---|---|---|
| Invesco Water Resources ETF | PHO | 0.60% | High concentration |
| First Trust Water ETF | FIW | 0.50% | Stricter revenue screen |
| Global X Clean Water ETF | AQWA | 0.50% | 36% in top 5 names |
Source: Article data, April 2026
Source: Article data, April 2026
The Invesco Water Resources ETF (PHO) and the First Trust Water ETF (FIW) have been the two dominant products in this space for most of the past decade, measured by assets. Both track indexes weighted toward large-cap water utilities and industrials. Neither is a pure play on water scarcity. PHO holds companies like Ecolab, Xylem, and Roper Technologies, which derive meaningful revenue from outside the water sector entirely. FIW applies a stricter revenue screen, but its top holdings still cluster around the same universe of regulated utilities and water treatment equipment manufacturers.
The Global X Clean Water ETF (AQWA) sits at a smaller scale and applies a more deliberately thematic lens, with its top five holdings as of April 2026 concentrated in American Water Works, Xylem, Ferguson, United Utilities Group, and Pentair. Those five names account for roughly 36% of the portfolio. In a fund marketed as broad infrastructure exposure, more than a third of capital rides on a handful of names that trade as a correlated cluster during rate-sensitive selloffs.
AQWA carries an expense ratio of 0.50%. That is not punitive by thematic ETF standards, but it is five times what an investor pays for a plain-vanilla S&P 500 fund, and over a ten-year holding period that drag compounds into real money. PHO charges around 0.60% and FIW comes in near 0.50%, so the category tends to cluster in that range rather than competing aggressively on cost. When all the thematic funds in a category price within a few basis points of each other, fee competition has effectively stopped. That is not an accident. It is a feature of niche ETF design.
The deeper structural issue is index construction. Most water ETFs license their indexes from providers like Nasdaq or MSCI, and those indexes define the universe using revenue thresholds: a company must derive some percentage of its revenue from water-related activities to qualify. The thresholds vary by index and are not always published in fund summaries in plain language. When Ferguson, a plumbing and HVAC distributor, sits in a clean water fund, it is because an index methodology counted its pipe distribution revenue as water infrastructure exposure. That may be defensible. It is also a reminder that the index provider, not the fund manager, makes the calls about what qualifies as a water investment. Retail buyers who assume the fund manager is running active screens are misreading the product.
The Utility Trap and Where Real Leverage Lives
AQWA Portfolio Concentration: Top 5 Holdings vs Rest of Fund
AQWA Portfolio Concentration: Top 5 Holdings vs Rest of Fund
More than a third of capital rides on just 5 correlated names
Full AQWA Portfolio (100%)
Top 5 Holdings (36% of portfolio)
Source: Global X Clean Water ETF (AQWA), April 2026
Source: Global X Clean Water ETF (AQWA), April 2026
The rate sensitivity embedded in these funds is not incidental. It is structural, a direct consequence of how the indexes funnel capital toward regulated utilities. American Water Works, the largest publicly traded US water utility, operates under state public utility commission oversight that sets allowable return on equity in a range that, according to widely cited industry estimates, has historically run somewhere in the single-digit-to-low-double-digit percentages depending on jurisdiction. That ceiling protects against a bad year and caps upside in equal measure. In a period of falling interest rates, utility stocks behave like long duration bonds and reprice upward as the discount rate falls, which explains why water utilities had a strong run through the rate easing cycle. In a rising rate environment, they compress. Which is exactly what happened between 2022 and 2024 when Fed policy pushed rates sharply higher.
An investor who bought PHO in early 2022 expecting to profit from accelerating municipal water spending faced a drawdown driven almost entirely by duration sensitivity, even as the underlying thesis on water scarcity remained intact. The thesis was right. The vehicle carried a different risk profile than the marketing implied.
The more asymmetric return potential in water investing sits further down the market cap scale, in companies building desalination technology, membrane filtration systems, and real-time water quality monitoring infrastructure. Names like Xylem carry some of that exposure, but as large caps they already price in most of the near-term growth. The genuinely early-stage water technology companies are either private or listed on exchanges outside the US where liquidity constraints make ETF inclusion difficult. The funds end up owning the mature end of the sector by necessity, not by choice.
One segment where structural tailwinds are still building rather than already priced is water recycling and reuse infrastructure in the US Sunbelt. Population growth in Arizona, Texas, and Nevada is forcing municipalities into large capital programs that recycle treated wastewater back into drinking supplies. The engineering firms and specialized equipment manufacturers serving that buildout are smaller, less liquid, and harder to hold in a large ETF. The funds own the utilities that operate the old infrastructure. The faster-growing capital opportunity is in the companies retrofitting it, and that gap between narrative and investable universe is widest precisely where the macro story sounds most compelling.
Sizing the Risks Retail Buyers Miss
How a Water ETF Is Built: From Index Rules to Retail Buyer
How a Water ETF Is Built: From Index Rules to Retail Buyer
STEP 1: Index Provider (Nasdaq, MSCI)
Sets revenue threshold rules
Decides what counts as a "water company" using % of revenue from water activities. Thresholds vary and are often unpublished.
STEP 2: Stock Universe Selected
Eligible companies added to index
Includes utilities, industrials, and distributors like Ferguson (HVAC and plumbing) if pipe revenue qualifies under the methodology.
STEP 3: ETF Issuer Licenses the Index
Fund manager tracks the index passively
Charges 0.50% to 0.60% expense ratio. The fund manager does NOT select individual holdings. The index provider does.
STEP 4: Retail Buyer
Receives regulated utility exposure
Buys a "water scarcity" thesis but holds rate-sensitive utility bonds in disguise, concentrated in a handful of correlated names.
OUTCOME: Rate Risk Mismatch
Portfolio falls during Fed tightening
Even when the water scarcity thesis is correct, duration risk inside utility-heavy construction drives drawdowns independently of the macro story.
Source: Article analysis of water ETF index construction
Source: Article analysis of water ETF index construction
Beyond rate sensitivity, water investing carries a political risk that rarely shows up in fund prospectus language. Water is a public good in most jurisdictions, which means rate increases require regulatory approval and often face political opposition. In the UK, Ofwat spent much of 2024 and 2025 tightening allowed returns and forcing large capital expenditure commitments from listed utilities including United Utilities and Severn Trent, both of which appear in global water fund holdings. The regulatory reset cycle in England and Wales compresses the allowed return on equity those companies can earn, directly affecting dividend capacity.
United Utilities, which holds a spot in AQWA's top five, operates entirely in the Northwest of England under that regulatory framework. An investor in AQWA is carrying UK regulatory risk without that being the headline story. The same dynamic applies across jurisdictions: French water operators face different concession rules, Asian utilities carry different political risk profiles, and the blended exposure in a globally oriented fund is not always legible from the fund fact sheet alone.
There is also a liquidity illusion at work in smaller water ETFs. AQWA's assets under management remain modest by ETF standards. When a thematic fund is small, the bid-ask spread widens during stress periods, and the cost of entering or exiting a position can erode returns in ways the headline expense ratio does not capture. The 0.50% annual fee is only part of the total cost of ownership. A fund with thin secondary market liquidity can cost an additional 10 to 30 basis points per transaction in spread alone, depending on market conditions. Anyone who traded small-cap thematic ETFs during March 2020 or the rate shock of 2022 saw those spreads materialize in real time.
So back to the opening question: are these funds designed to capture the infrastructure opportunity or simply to price it? Honestly, they do both at once, in proportions that favor the latter. What water ETFs deliver is regulated utility cash flows plus some industrial equipment exposure, packaged inside a thematic narrative that commands a fee above what a plain utilities index charges. The macro thesis is not wrong. The structure captures a narrower, more rate-sensitive slice of it than the marketing implies. Buyers who treat these products as infrastructure plays are holding something that behaves like a rate-sensitive bond proxy with a green label attached. The 2022 drawdown made that plain enough, even as the water crisis kept getting worse.